
CDFIs weathering the storm
CDFI Loan Funds Trends Report based on June 30, 2026 Financial Data
At CQ2 2026, growth appears to be paused as CDFIs manage a difficult operating environment for both themselves and their borrowers. Total assets and total gross loans outstanding are roughly comparable to those at CYE 2025.
Peer Group portfolio performances are historically weaker but are still manageable and supported with appropriate allowances. Earnings are also showing some strain with a relatively high incidence of operating losses. Finally, the cost of debt continues to be high relative to historical levels, presenting another challenge to growth.
Capital, however, remains solid. Unrestricted net asset ratios were at or near review period highs, and conversely, CDFIs had low leverage, providing strong protection for their lenders and a strong position to manage current challenges and future uncertainties. While lending volume will be lower than in a growth period, CDFIs will continue to responsibly revolve their capital, work with borrowers to ensure success, and be active champions for community development.
METHODOLOGY
This Aeris analysis draws on data from 144 CDFIs holding a total $24.7 billion of on-balance-sheet assets. To avoid distortions in the median and quartile measures, we excluded a few CDFIs that had not yet submitted data for calendar year end (CYE) 2025 and calendar second quarter end (CQ2). We continually add new CDFIs to the database and update peer groups to capture better representations for shifting lending patterns. Please note that many CDFIs engage in more than one type of lending activity, as well as other lines of business, including managing assets held in nonconsolidated affiliates or other structures.
In this analysis,
- The Community Facility and Commercial Real Estate Development Lenders, “CFL” group consists of 19 CDFIs with total assets of $9.9 billion and a median of $268.6 million. This peer group has CDFIs with the largest asset sizes – apart from one outlier on the high side of $3.7 billion and two on the low side of $9.5 million and $3.6 million, the core group ranged from $34.7 million to $869.0 million.
- The Housing Development Lenders, “HDL” group consists of 45 CDFIs with total assets of $9.9 billion and a median of $151.9 million. The sizes of this group ranged from $23.7 million to $1.5 billion, with one outlier of $5.3 million.
- The Small Business and Micro Lenders, “BML” group consists of 80 CDFIs with total assets of $4.9 billion and a median of $43.2 million; sizes for this group ranged from $1.8 million to $268.3 million, with one outlier of $411.6 million.
The review period for this analysis is Statement of Position point-in-time data at calendar year-ends (CYEs) for 2017 through 2025 and calendar second quarter-end (CQ2 i.e. June 30) 2026 and Statement of Activity data for CQ2 results from CQ2 2017 to CQ2 2026. Contributed revenue and some earned revenue (such as New Market Tax Credit [NMTC] fees) can be variable across a fiscal year so mid-year results are not necessarily indicative of full fiscal year performance. In addition, fiscal year ends of roughly 40% of each peer group are not calendar year ends, so CQ2 earnings cover different portions of the fiscal year. Nonetheless, in the current environment, Aeris believes that it is worthwhile to track CQ2 Statement of Activity line items despite the potential distortions. Full fiscal-year earnings analyses will be done after CYE 2026, when the majority of CDFIs complete their fiscal year.
2020 and 2021 data reflect most of the effects of the pandemic on CDFIs; these effects decreased thereafter.
GROWTH: A PAUSE IN CDFI GROWTH
Summary Recent Growth Measures, Medians

Note: CAGR=Compound Average Growth Rate.
In the graphs below, the scale of the CFL and HDL peer groups (with larger assets and portfolio sizes) causes their rate of growth to appear higher in comparison with the BML group. The table above provides actual change percentages for the most recent periods. Moreover, the number of CDFIs in the CFL peer group increased from 15 in 2019 to 19 in 2021, which caused a significant change in the median portfolio size and many median data points, most notably in Core Loan Portfolio outstanding.
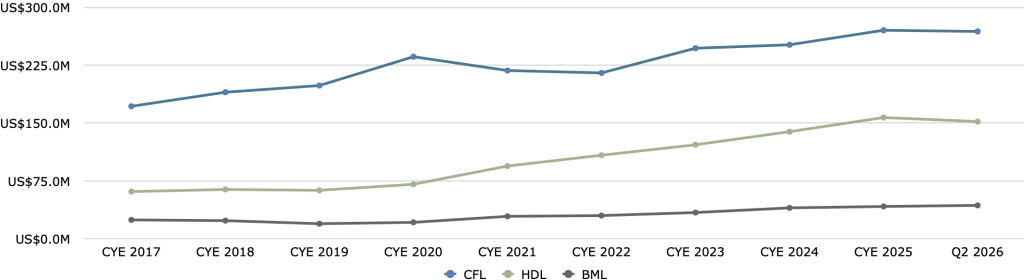
Capital: Total Assets, Median
Core Loan Portfolios*, Median
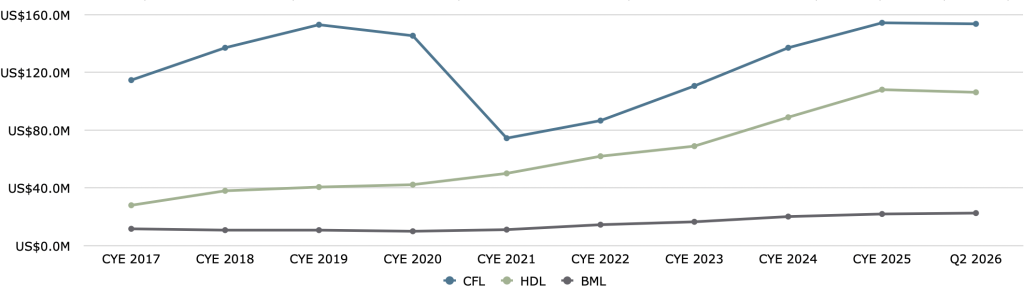
* Core loan portfolios exclude loans made under the Paycheck Protection Program (PPP) during the pandemic years.
As reflected in both the table and the figures, total assets and core loan portfolios are no longer showing significant growth. For the CFL and HDL peer groups, the median measures have decreased modestly from CYE 2025 to CQ2 2026. For the BML peer group, while still growing, the median increase is on pace for an annual 2026 increase lower than the previous three-year CAGR. It is worth noting that these are median figures. Some CDFIs are continuing to grow, while others are decreasing in size, depending on individual circumstances.
PORTFOLIO PERFORMANCE: SIGNS OF DECLINE
Aeris uses median metrics for most of the analysis to reflect peer group performance. However, to be more conservative, we use bottom quartile metrics in our analysis of portfolio performance.
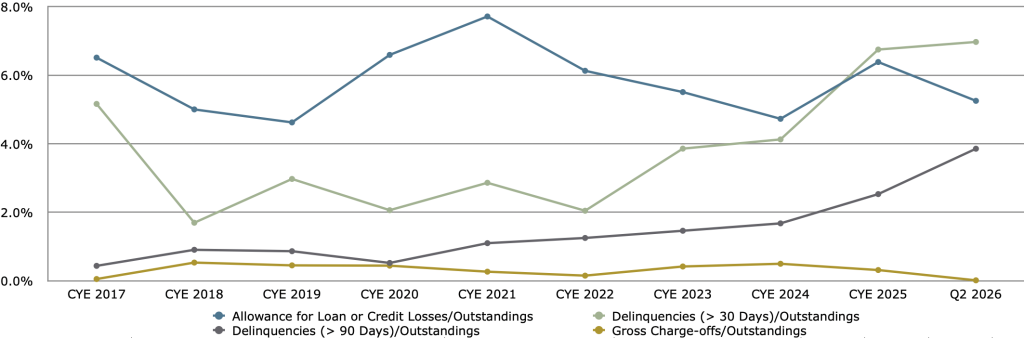
CFL Portfolio Performance, Bottom Quartile
HDL Portfolio Performance, Bottom Quartile
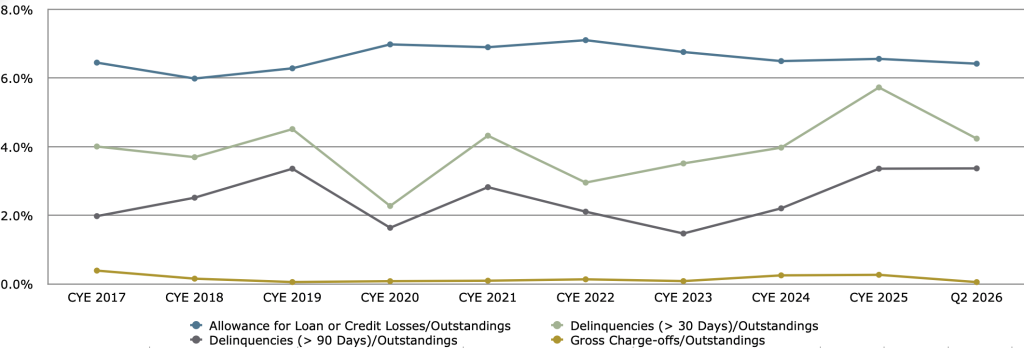
At CQ2 2026, gross charge-offs for the CFL and HDL peer groups were both at 0%, consistent with historic performance, but represented a partial year for the majority of CDFIs and may increase by CYE. Delinquencies >90-day and >30-day were at their highest levels for the CFL peer group and at or near their highest levels for the HDL peer group. While delinquency levels are still manageable for mission driven lenders, it appears to reflect growing challenges, such as increased costs and scarcer real estate project subsidies.
Although the Allowance of the CFL peer group has dipped below >30-day delinquencies for the first time in the review period and is nearing the >90-day delinquencies level, it still far exceeds historical charge-offs. CDFIs set allowances that meet GAAP standards and currently use an allowance setting methodology that typically classifies the portfolio into separate loan pools with similar historical loss performance, to which it applies loss rates and factors for extraordinary market risk conditions.
BML Portfolio Performance, Bottom Quartile*
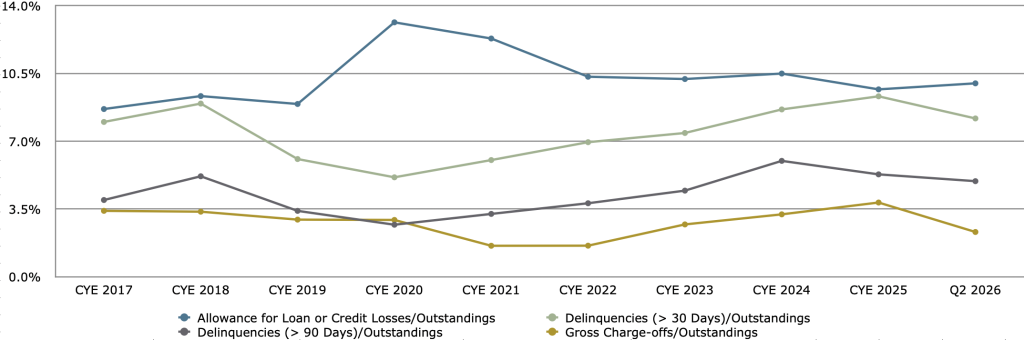
*This figure show results for 77 BML CDFIs which provided clean portfolio data for this report.
Delinquencies and charge-offs for the BML group have been steadily increasing since the pandemic, when borrowers were receiving extraordinary supports. Delinquencies >90-days dipped slightly in FY 2025, but >30 day delinquencies and gross charge-offs reached review period highs, reflecting challenges in the small business operating environment such as inflation and immigrant market disruption. Delinquencies at CQ2 appear to have improved somewhat but are nonetheless at the higher end of the review period range.
As noted previously, charge-offs at CQ2 reflected a partial year for the majority of CDFIs. In addition, for smaller CDFIs, many in this peer group, charge-offs are often delayed and taken at fiscal year-end. Due to both factors, the BML measure for CYE 2026 will likely increase.
EARNINGS: MIDYEAR RESULTS SHOW STRAINS
Median Results
Earned Revenues, Median
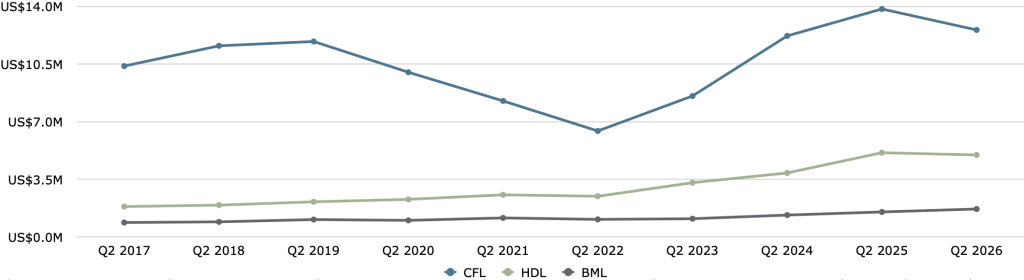
For CQ2 2026, median earned revenues were lower compared to CQ2 2025 for both CFL and HDL peer groups, by 9.2% and 2.6%, respectively. Only for the BML peer group, the CQ2 earned revenues were higher, by 11.8%. These result are not surprising given portfolio sizes in the CFL and HDL groups are flat, while the BML portfolios are still growing slightly. Portfolio interest, while not the only component, is a significant component of earned revenues.
Contributed Revenue, Median
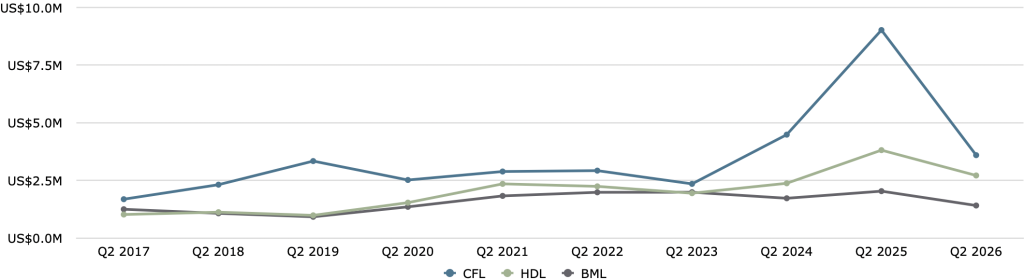
Median contributed revenue for CQ2 2026 was lower for all three peer groups in comparison to CQ2 2025, but at CQ2 2025 this revenue category had been at historically high levels. At CQ2 2026, contributed revenues for the CFL group was the third highest of the review period and for the HDL group, the second highest. At the same point in time, BML contributed revenue was most challenged, with a median below $1.5 million for the first time since CQ2 2021.
Operating Expenses, Median
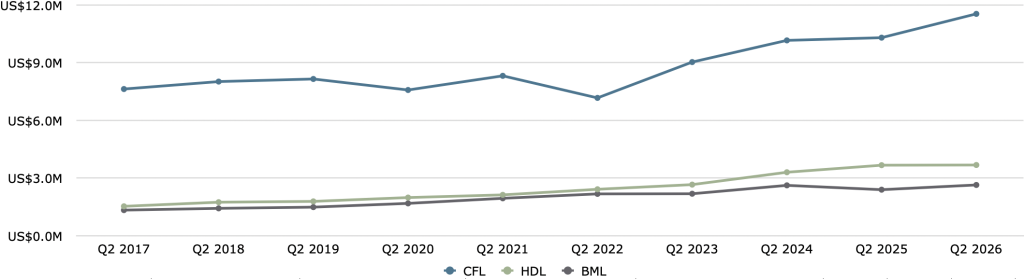
Median operating expenses for CQ2 2026 for the CFL and BML groups were higher by 12.0% and 10.3%, respectively; while the median for the HDL group remained roughly level.
Degree of Strain
Percentage of Peer Group with CQ2 Operating Losses

The incidence of operating losses historically has been variable in all peer groups, with the BML peer group generally experiencing the highest incidence of operating losses. At CQ2 2026, the incidence of operating losses are at historically high levels for the ten year review period:
- CFL peer group – fourth highest
- HDL peer group – highest
- BML peer group – second highest
CDFIs are facing challenges on both earned and contributed revenue, as shown in the graphs. Historically, CDFIs have proven themselves to be effective agents to further government policy objectives, and through this record of achievement, have had robust revenue streams both through contract revenue and grants. They are now facing challenges on both earned and contributed revenue as the current administration has cut budgets and staffing of many of the departments and programs with which CDFIs have historically worked, and/or from which they have received grant awards, either directly or through state and local government entities. With reduced government funding, private philanthropy is under greater pressure making grants increasingly competitive.
Operating Surplus (Loss) / Unrestricted Net Assets, Bottom Quartile
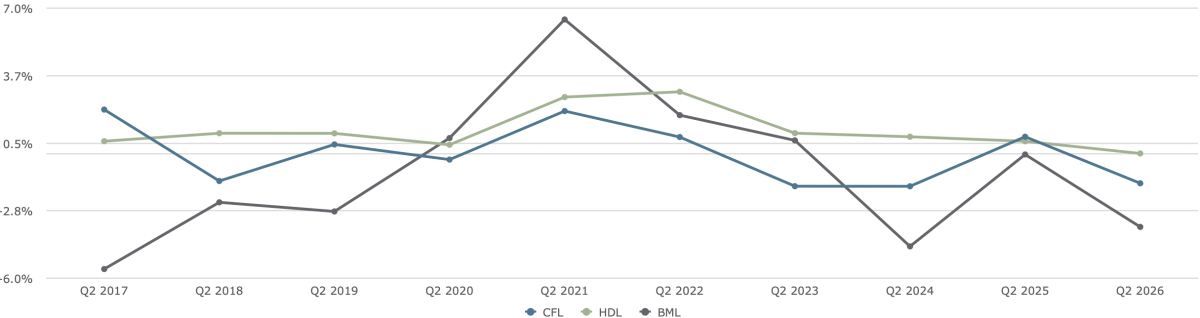
This graph is designed to show the significance of losses in relation to unrestricted net assets. Given the incidence of losses, it is not surprising that the ratios of “operating surplus (loss) / unrestricted net assets (UNA)” at Q2 2026 are near the lower range of the review period. Since this graph shows the top of the bottom quartile, individual CDFIs below the quartile mark will have greater losses in relation to UNA.
It is crucial to keep in mind that contributed revenues and some earned revenues (such as NMTC fees) can be variable across a fiscal year so mid-year results are not necessarily indicative of full fiscal year performance. In addition, fiscal year ends of roughly 40% of each peer group are not at calendar year ends, so CQ2 earnings cover differing portions of the fiscal year. Given these factors, full fiscal year 2026 results may be significantly different than results at CQ2 2026.
Unlike revenues and some financing expenses such as loan charge-offs, which can be variable, operating expenses, with personnel as the largest component, are more consistent over a fiscal year. If the operating environment continues to be challenging and portfolios remain flat, more drastic expense control may be necessary.
COST OF DEBT: HISTORICALLY HIGH
Average Cost of Debt, Median
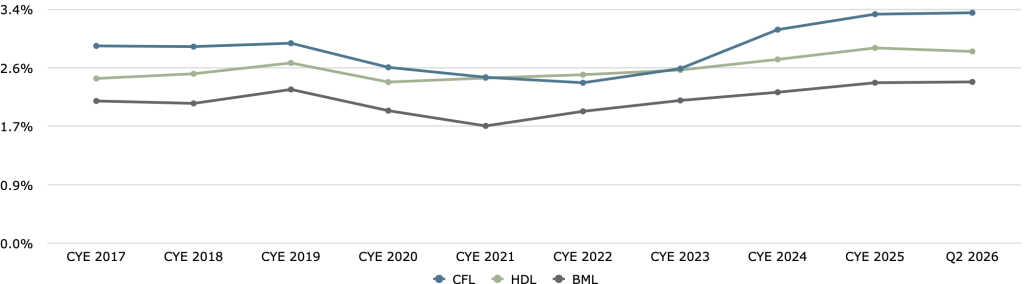
CDFIs have historically operated within a narrow range of average low-cost debt. Some of the larger CDFIs in the CFL and HDL peer groups have accessed public markets, which provide large amounts of capital at market-rate interest, leading to an increase in the average median cost of debt for these peer groups. In 2024, new debt from bank investors, the industry’s largest creditor sector, also began to carry higher pricing. The result is that at CYE 2025 and CQ2 2026, the average cost of debt for all peer groups was near, or at, the highest of the review period: 3.3% for CFL, 2.8% for HDL, and 2.3% for BML. However, this is still significantly below market rates because CDFIs’ debt sources include philanthropic institutions and impact investors that are less sensitive to market rates.
As noted in our last review for CYE 2025, over time, increased debt rates will put pressure on CDFIs’ loan pricing. Higher pricing may affect the feasibility of the projects CDFIs wish to fund. Given the already challenging operating environment, any increase in CDFI loan pricing could also dampen loan demand.
CAPITAL STRUCTURE: CONTINUED STRENGTH
UNA Ratio: Unrestricted Net Assets / Total Assets, Median
Leverage: Total Debt / Net Assets, Median
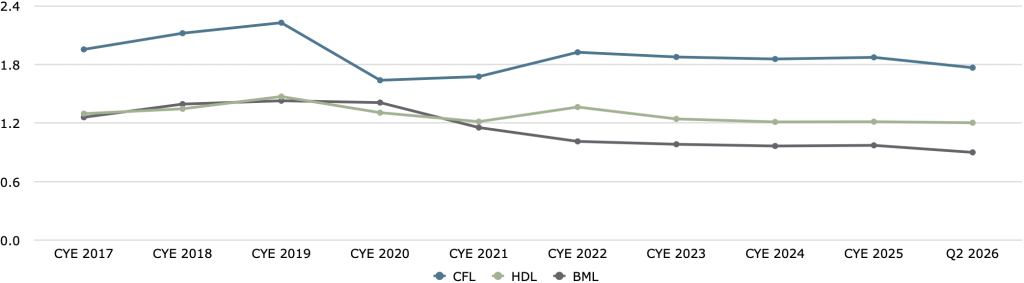
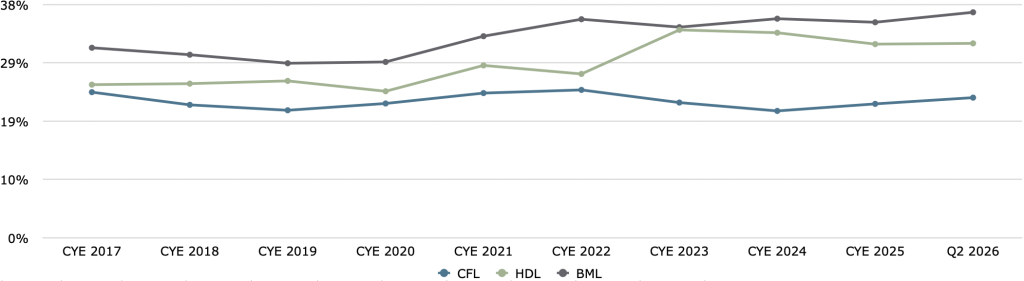
Relative to the BML peer group, CFL and HDL business models are able to operate with lower unrestricted net asset ratios and higher leverage because of their higher self-sufficiency, lower-risk loan portfolios, and stronger, real estate collateral. At CQ2 2026, unrestricted net assets ratios and leverage for all three peer groups were at or near the strongest level of their historical ranges:
- The CFL peer group operated with UNA ratios of 20%-25% over the review period; at CQ2 2026, the median UNA ratio was 22.8%. Leverage primarily ranged between 1.5 and 2.0; at CQ2 2026, the median leverage was 1.8.
- The HDL peer group had been operating with UNA ratios around 25% before the pandemic period, but strong operating surpluses in CY 2023 pushed up their level to 30%; the median UNA ratio at CQ2 2026 was 31.7%. However, leverage for this group, which includes both unrestricted and restricted net assets, has been very stable at 1.2 from CYE 2023 to CQ2 2026.
- The median UNA ratio for the BML peer group, with its business model requiring the strongest net asset ratio, has moved from a historical norm of 30% to 35%; it reached 36.8% at CQ2 2026, the highest level of the review period. Leverage decreased to its strongest level of 0.9. This group consists of smaller CDFIs that carry higher risk loan portfolios, and show lower self-sufficiency than CDFIs in the CFL and HDL groups. Accordingly, they are more vulnerable to the current operating environment. A stronger net asset base in the current operating environment is especially valuable for the BML peer group.
Deployment (Loans Outstanding / Net Assets + Debt for Financing), Median
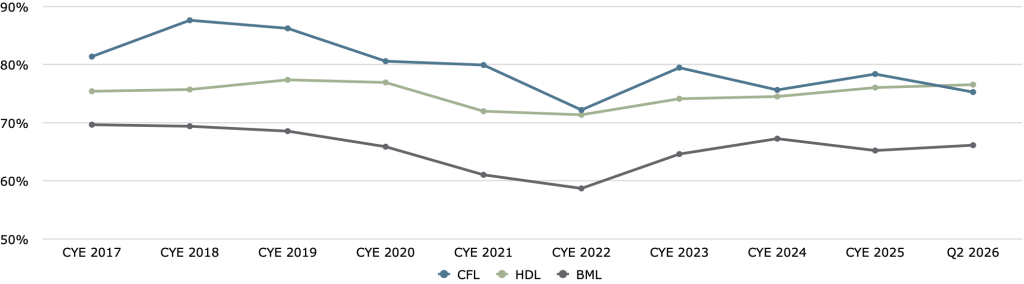
Deployment is a simple measure of capital liquidity, calculated using on-balance sheet data. CDFIs use a variety of tools to manage capital liquidity, such as debt with draws, lines of credit, and selling loans and loan participations, none of which is captured in the simple deployment calculation. Nonetheless, deployment is a relevant measure to assess the field’s relative liquidity and capacity to lend over time. However, deployment does not impute market demand, which could be dampened by economic uncertainty or increased due to tightening commercial credit markets.
The three peer groups have all managed deployment around a relatively stable norm, excluding the period following the pandemic period, at CYEs 2021 and 2022, when CDFIs received historically high levels of grants to support activities and boost lending capacity, with a predictable lag in deploying resources into loans. Deployment largely returned to historical levels post-pandemic as lending caught up with increased resources. Metrics have not changed much since CYE 2025.
- The CFL peer group seems to have somewhat more on-balance-sheet capacity than in the past, with deployment of 75.3% at CQ2 2026. This peer group includes many large, sophisticated CDFIs with off-balance sheet facilities to draw on for additional liquidity if needed.
- The HDL peer group has maintained very stable on-balance-sheet deployment in the 75% range with deployment of 76.6% at CQ2 2026. Like the CFL peer group, the HDL peer group includes many large, sophisticated CDFIs with off-balance-sheet facilities to draw on for additional liquidity.
- The BML peer group typically has the lowest on-balance-sheet deployment, at around 70% before the pandemic, and experienced the greatest pandemic effect. Some of these CDFIs participate in SBA programs and can sell guaranteed portions of qualifying loans. While the market for such sales is healthy and established, recent changes at the SBA (such as reduced staffing, more restrictive rules for eligibility to participate, etc. ) may be curtailing CDFIs use of these programs. Deployment for the BML peer group was 66.1%.
Stable total assets, stable loan portfolios, and stable deployment levels do not mean CDFIs have stopped lending. Instead, while lending volume will be less than in a growth period, CDFIs continue to lend using their portfolios’ principal repayments, and continue to work with their borrowers to ensure borrower success.
Are you an investor with questions about the performance of your own CDFI portfolio? We are eager to hear from you. Contact us if you would like to discuss your portfolio, ask questions, or hear more about what we are seeing through our CDFI ratings and data collection work. Are you a CDFI loan fund that would like to participate in our database? Let us know.
Stay In Touch